Analytics + strategy
We don’t do “hit and hope” marketing. We’re a data-driven team that uses detailed analytics to precisely monitor campaign success, powering-up what works and offloading what doesn’t.
Summary: the quick version of this page
We use industry standard web analytics tools including Google Analytics and Microsoft Clarity to monitor how many users are coming to your website, how they’re getting there, and what they do while they’re on your website. We also use QR codes on printed marketing materials to track the reach and success of offline campaigns. We then use these insights to inform advertising and digital strategy and make ongoing improvements to your website or online store.
Google Analytics built in
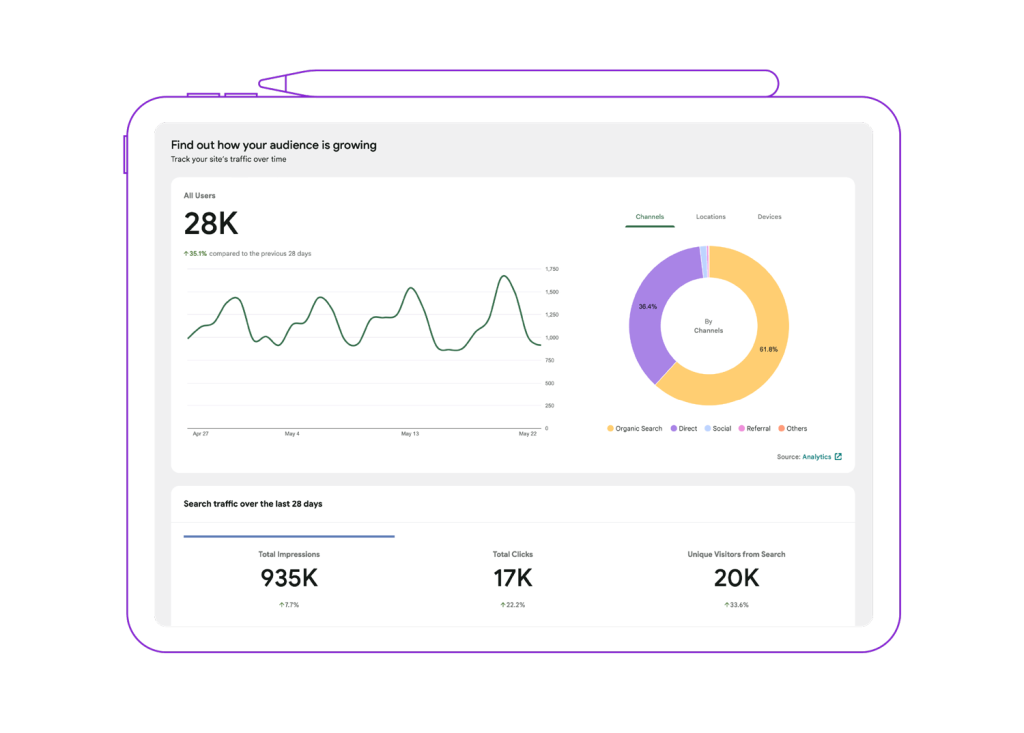
At Mix Digital, we believe in empowering our clients with valuable insights in order to make data-driven decisions. That’s why every website and online store we build comes with Google Analytics integration as standard. Google Analytics is a powerful (yet free) web analytics service that provides in-depth information about website traffic and user behaviour.
These insights help us to measure the effectiveness of our web designs and website builds, allowing us to make any necessary adjustments for optimal website performance. With Google Analytics, these insights go beyond just knowing how many people visit the site; they delve into the specific pages people view, the time spent on each page, and even the actions web users take, like filling out contact forms or making purchases.

Measuring marketing campaigns
Google Analytics gives us a detailed overview of how different marketing campaigns are performing, and most importantly which channels are driving the most traffic. This can quickly and clearly identify where money is being well spent, and where it’s being wasted, allowing us to refine our clients’ marketing strategies and allocate resources more effectively.
For example, if your Facebook ads were not bringing in many website users – or were bringing in users who didn’t convert – it would make sense to move that budget elsewhere or adjust the Facebook ad campaign in order to get the results you’re after. This pinpoint accuracy allows us to double down on what works and offload what doesn’t, at any given time, not just at the end of a marketing campaign.
Monthly reports in your inbox
We can set up a monthly report that arrives in your inbox as a PDF with all the key statistics for your website or online store. This gives you real insight into how many people are visiting your website, where they’re coming from, and the content they’re seeing most often, as well as an indication of how your marketing campaigns are tracking – even if you’ve set up a campaign yourself or with another agency.
Aside from the initial set up cost – which covers our time to tailor the reports to capture the key data points that matter to your brand – there’s no ongoing cost to you for this service.
Microsoft Clarity: see how real people use your website
Microsoft Clarity, launched in 2022, is a relatively new analytics tool that focuses more on user behaviour (how people use your website) rather than traffic numbers and acquisition (where people are coming from to reach your website). This makes Clarity a powerful companion to Google Analytics as it shows us how real people interact with specific pages on your website. And, like Google Analytics, Microsoft Clarity is 100% free to use.
Heatmaps: see where users are clicking and scrolling
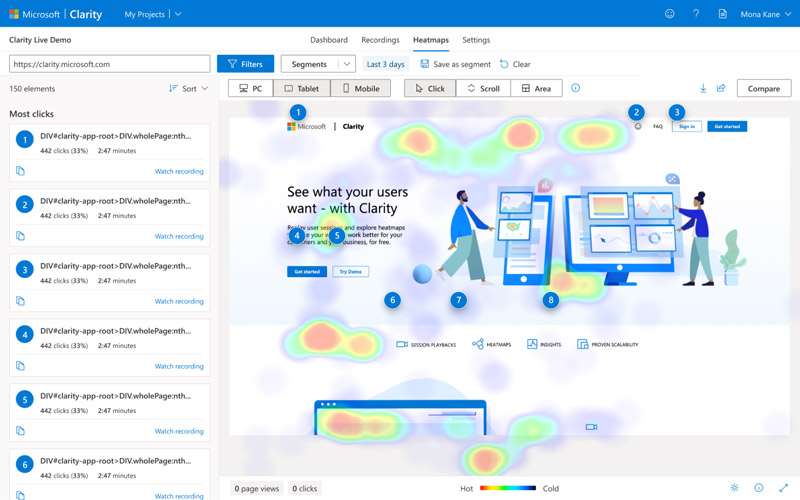
Perhaps Clarity’s best feature, click heatmaps show us where people are clicking on each page of your website, including clicks that users make on items that aren’t actually clickable. This reveals which areas are the most popular in terms of interaction, and can also show us whether users are confused about the layout of your page (if there are a lot of clicks showing up on a page element that does nothing when clicked).
Scroll heatmaps are also available to show the scrolling behaviour of website users, such as how far down people are reaching on a page before they click a call-to-action or somewhere else, or exit the page altogether. This can then inform content hierarchy if there is important information that most website users are not reaching. This can be filtered by device type to give even more granular insight about how people interact with your content on mobile versus desktop or tablet.
Bridging the gap between offline and on
For our clients who have offline design requirements such as billboards, posters, and brochures, we often incorporate QR codes to bridge the gap between the physical and digital worlds. QR codes enable your customers to simply scan the QR code on their phone to head straight to your website, and because we include tracking parameters in the QR codes themselves, we’re able to track user engagement and measure the effectiveness of these printed marketing materials.
Not only does this offer your customers a seamless transition to your website or online store, it gives us valuable insights in to campaign ROI and which printed items are performing better than others, helping to inform offline campaign strategy in future.
We work with the following platforms and technologies:
- Google Analytics
- Google Tag Manager
- Microsoft Clarity
- QR codes to track offline behaviour online
Our analytics + strategy services include:
- Setup of Google Analytics
- Integration of Google Analytics with websites and online stores
- Using analytics data to inform advertising strategy
- Setup and integration of Google Tag Manager
- Custom event tracking for websites (eg. how much of a video did people watch)
- Setup and integration of Microsoft Clarity
- QR codes for printed marketing materials to track online behaviour
Grow further with these services too:
Price calculator: Get an instant price indication for your project